There has been a slight dip in cryptocurrency market activity over the past 24 hours, resulting in a decline in the total crypto market cap (TOTAL) and Bitcoin’s (BTC) value. XLM, the native coin of the open-source blockchain network Stellar, leads with the most losses during that period.
In the news today:
- The meme coin platform Pump.fun has come under fire for its livestream feature, which has been exploited for harmful activities, including a developer promoting self-harm.
- Spot Bitcoin ETFs in the US are on track to become the largest holders of BTC, surpassing Satoshi Nakamoto’s holdings while also closing in on gold ETFs in total net assets.
.divm, .divd {display: none;}
@media screen and (max-width: 768px) {.divm {display: block;}}@media screen and (min-width: 769px) {
.divd {display: block;}}
Sponsored
The Crypto Market Remains Resolute
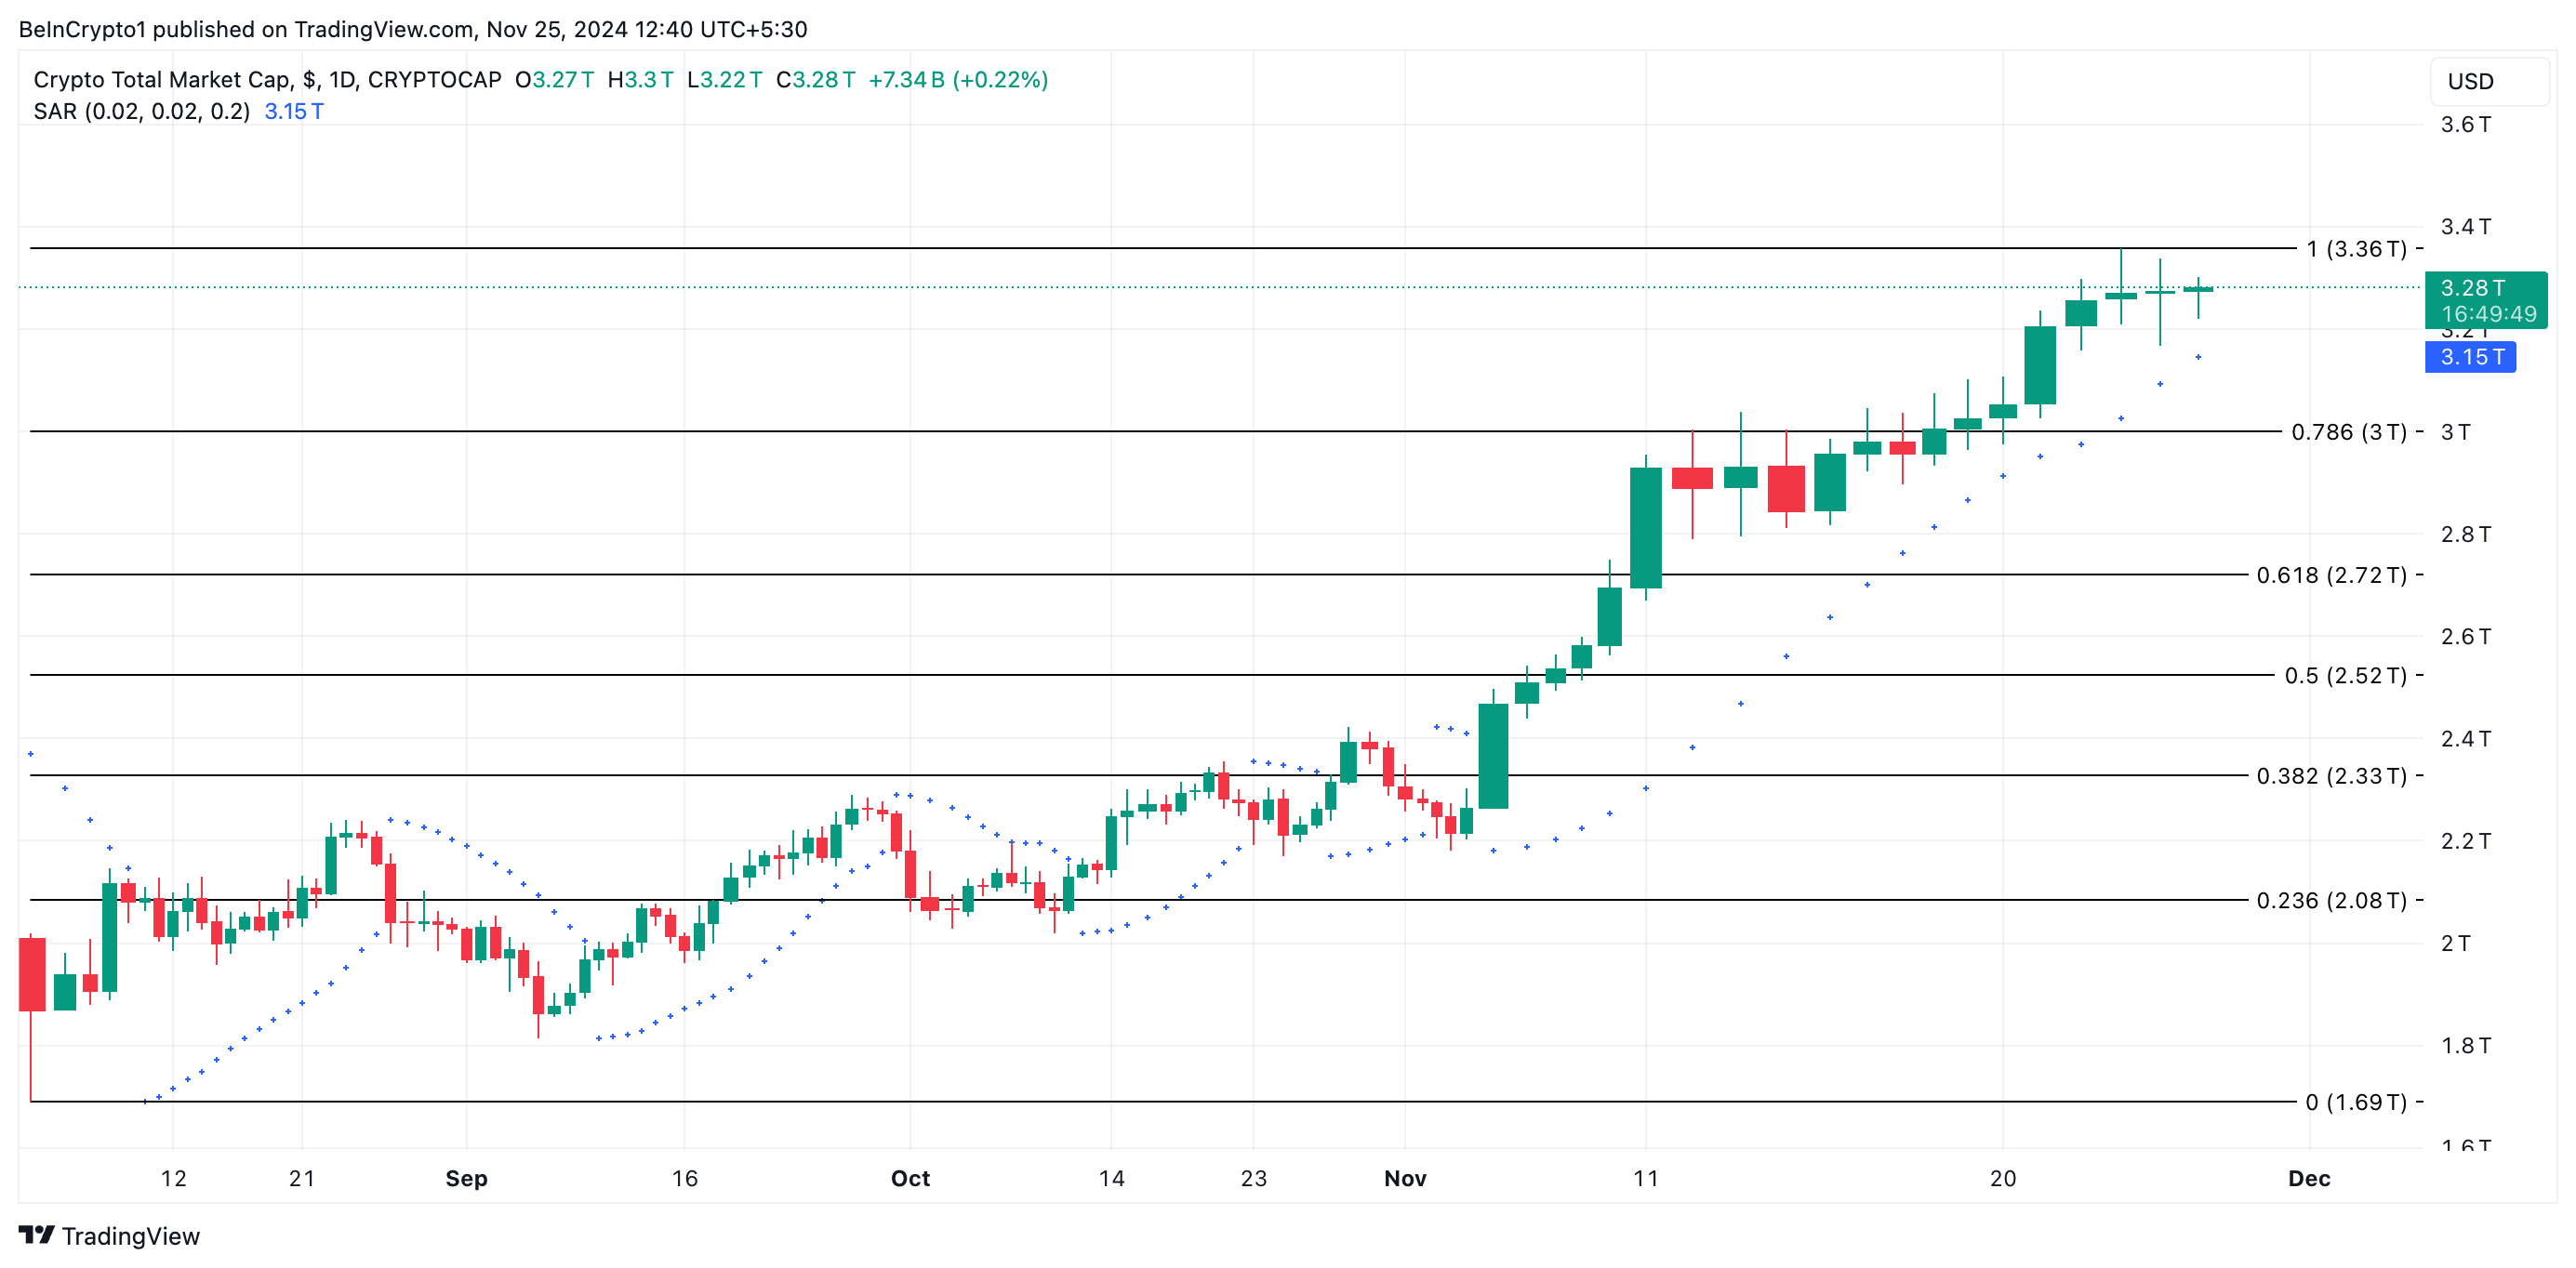
The total crypto market capitalization has dropped by $16 billion over the past 24 hours. TOTAL currently stands at $3.28 trillion, holding steady above the critical support level of $3 trillion. This signals the potential for continued growth.
Moreover, bullish sentiment remains significant among market participants, as evidenced by the Parabolic Stop and Reverse (SAR) indicator. At press time, the dots of this indicator rest below TOTAL.
This indicator measures the strength of a trend and identifies potential reversal points. When Parabolic SAR dots appear below the price, it signals a bullish trend, indicating that prices are likely to continue rising.
Sponsored

If bullish bias persists, TOTAL will reclaim its all-time high of $3.36 trillion. However, a dip below support at $3 trillion could result in a drop to $2.72 trillion.
Bitcoin Faces Resistance at $99,000
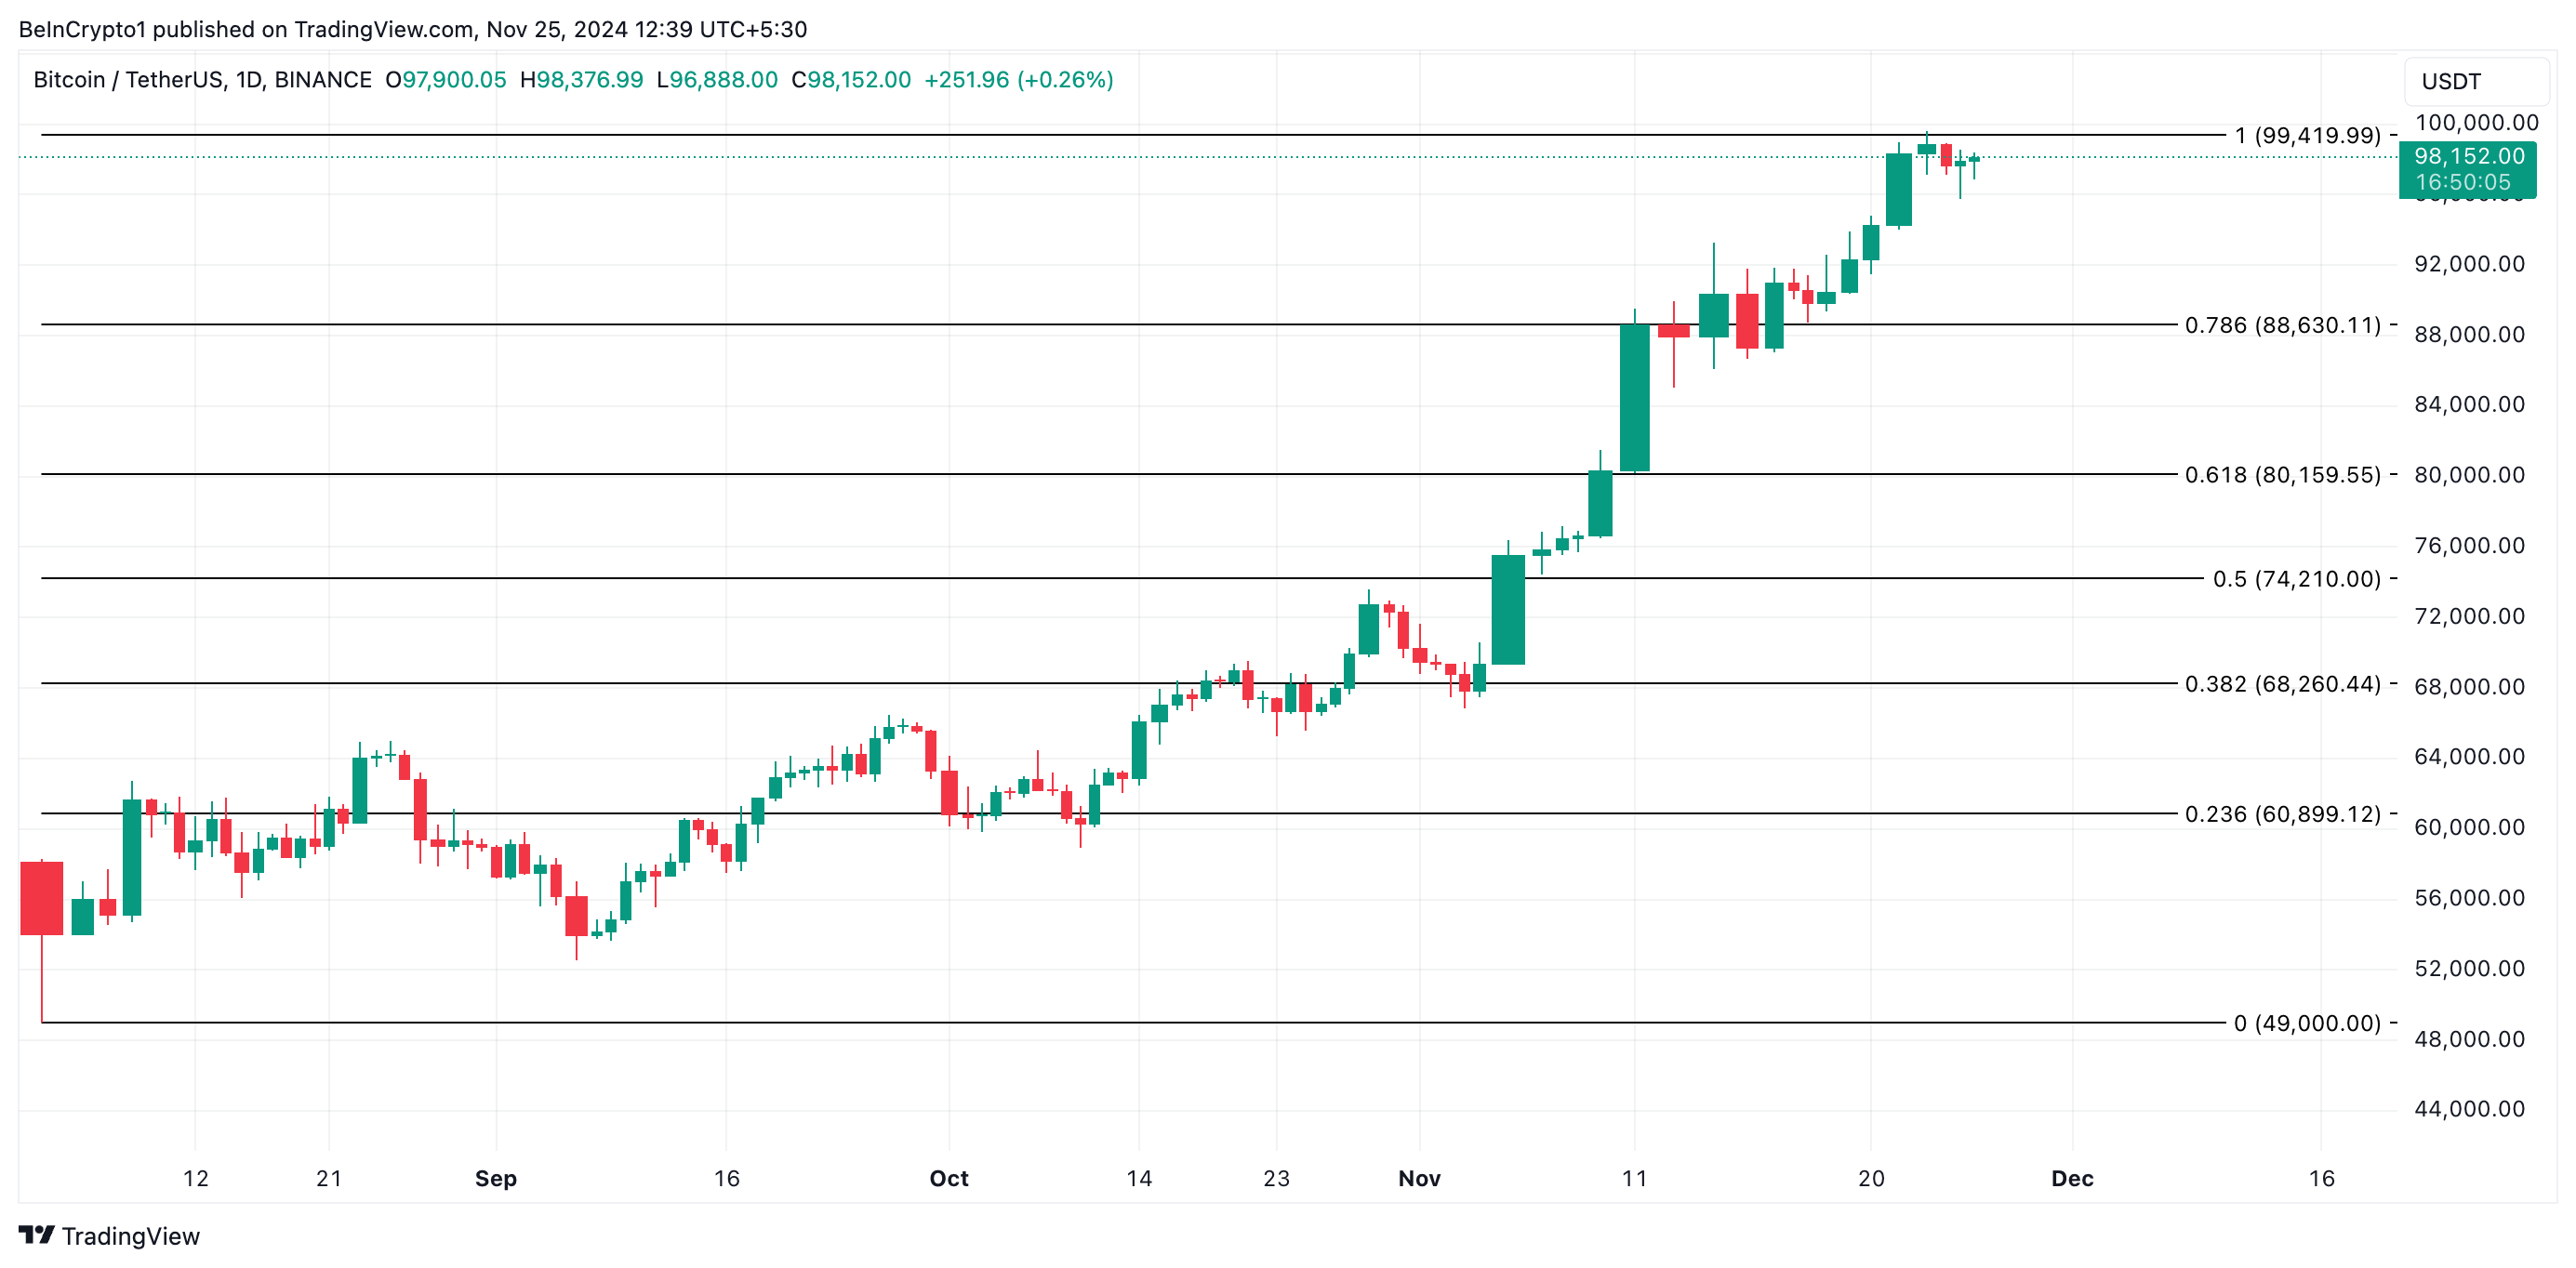
Bitcoin trades at $98,152, noting a 0.21% price decline over the past 24 hours. During that period, its trading volume rose by 27%, reflecting the spike in selling pressure.
When an asset’s price drops amid a spike in trading volume, it suggests strong selling pressure. This indicates that more traders are offloading the asset, potentially signaling a bearish trend or market panic.

Since registering a new all-time high of $99,419, BTC has faced strong selling pressure. That price level has become a resistance ceiling, with a support floor formed at $88,630. The strengthening selling pressure may pull BTC’s price toward this price floor.
.divm, .divd {display: none;}
@media screen and (max-width: 768px) {.divm {display: block;}}@media screen and (min-width: 769px) {
.divd {display: block;}}
Sponsored
However, if buying activity witnesses a resurgence, BTC’s price may rally toward its all-time high and exceed it.
Stellar Tops the Losers’ Chart
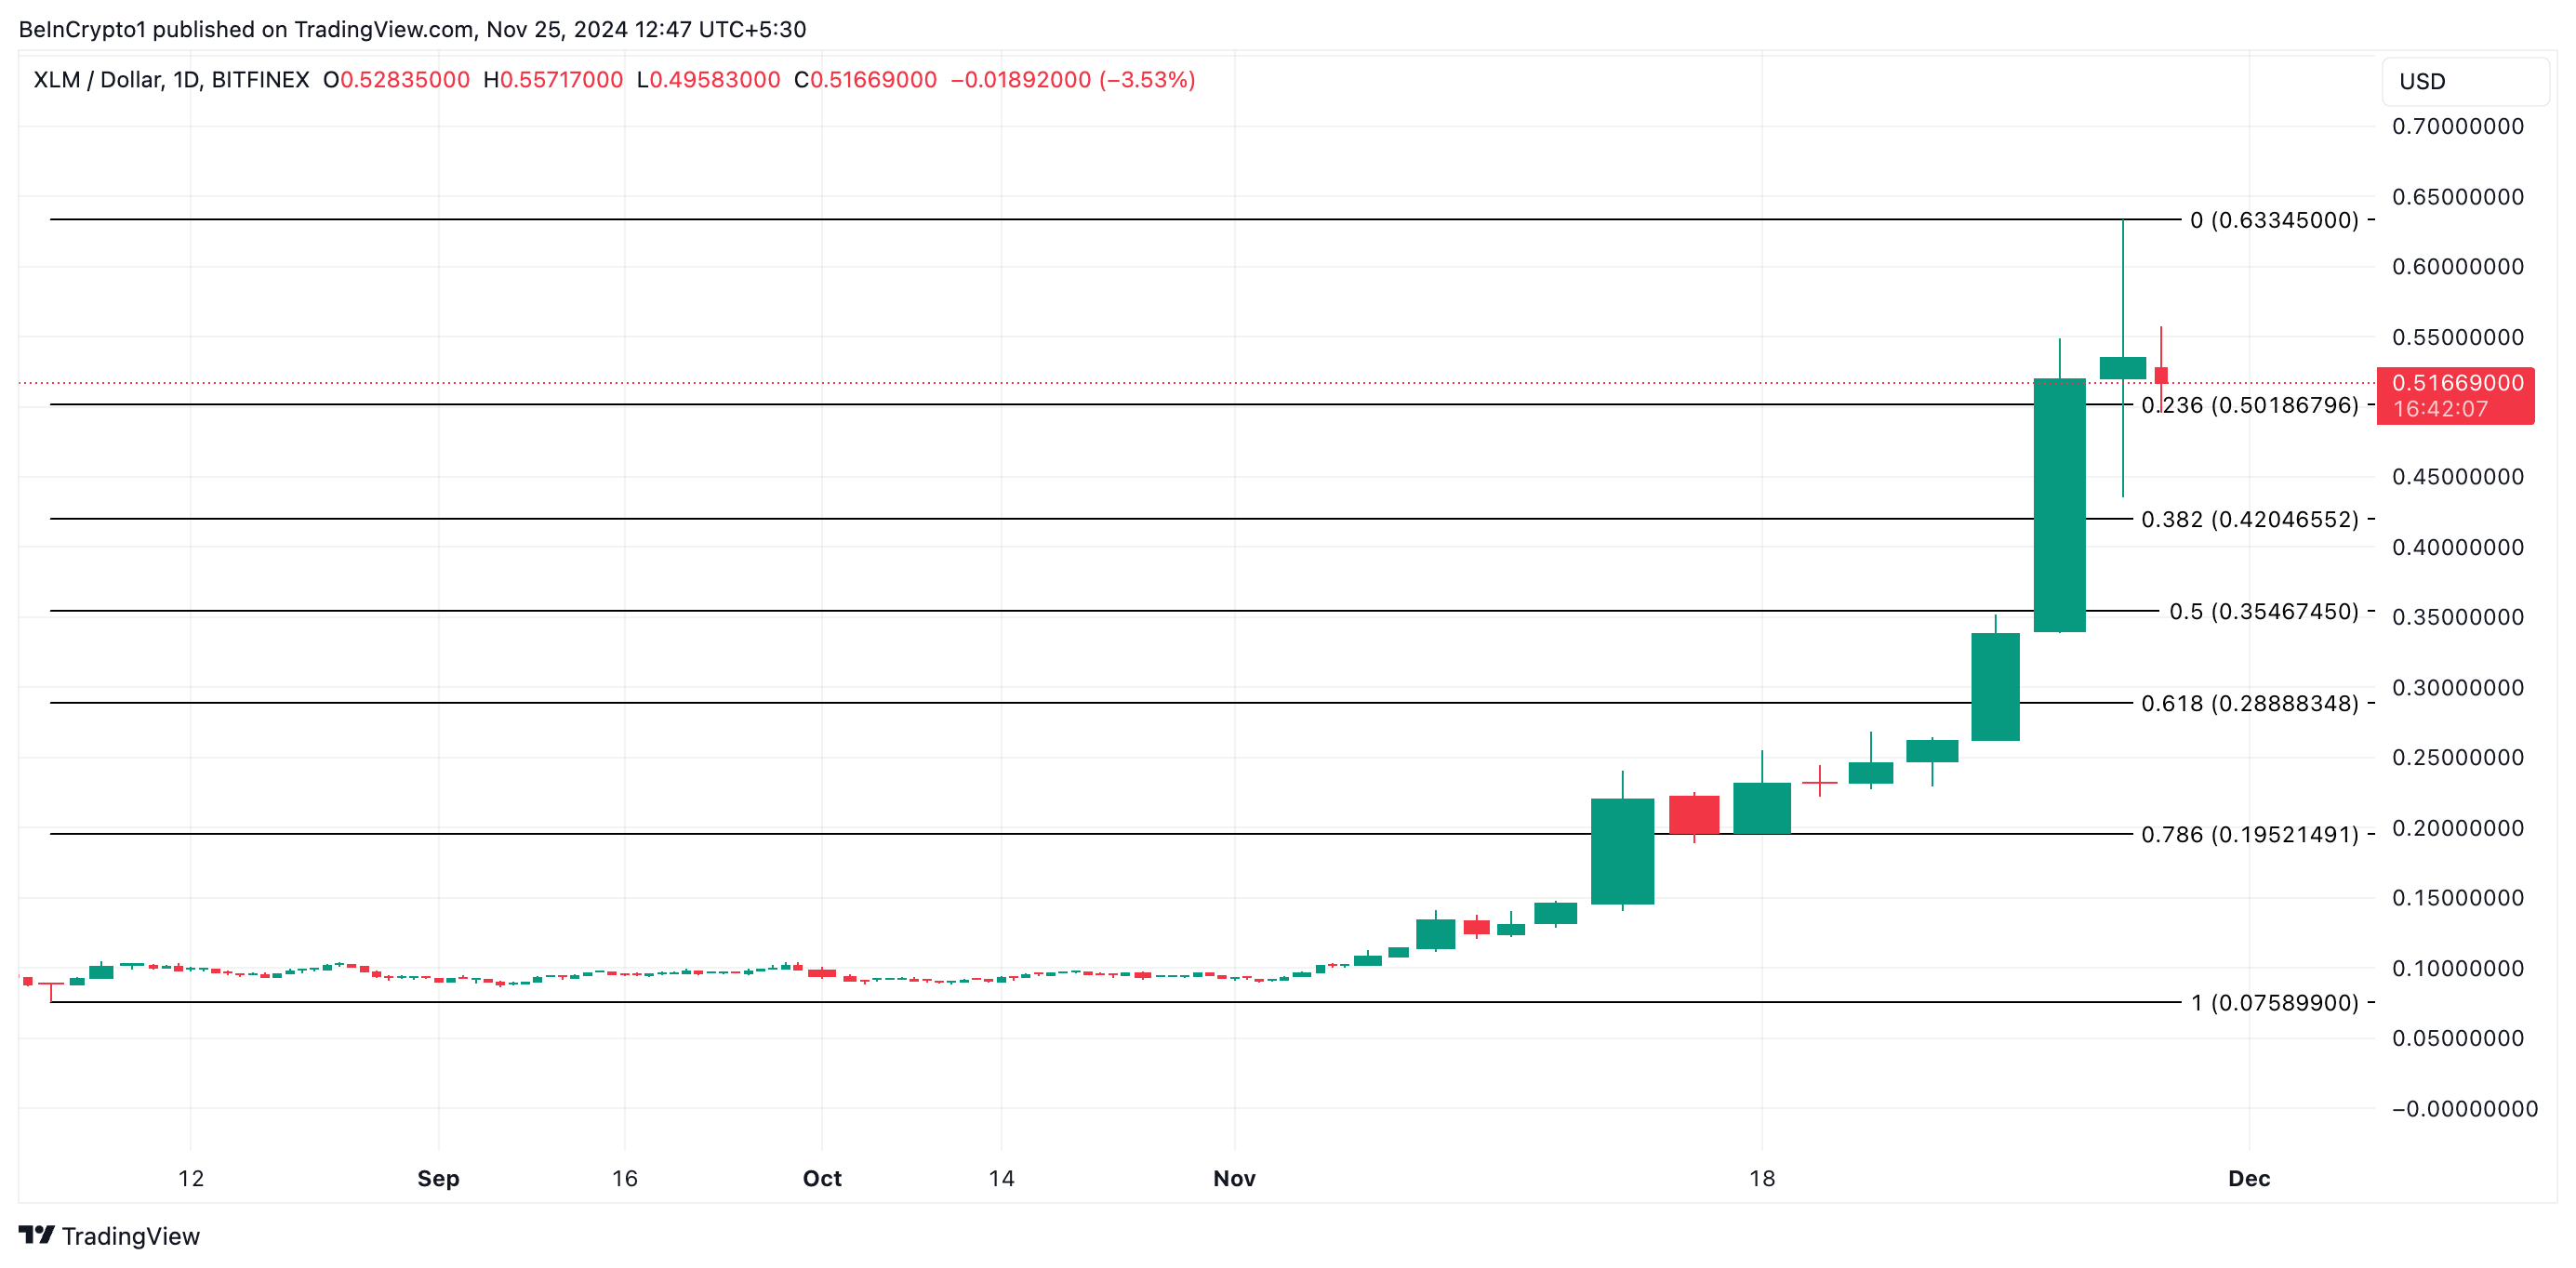
Stellar’s XLM is the market’s top loser over the past 24 hours. It currently trades at $0.51, having shed 10% of its value during the period in review.
This double-digit decline comes after the altcoin climbed to a three-year high of $0.63 during Sunday’s trading session. If profit-taking activity strengthens, XLM’s price will breach the $0.50 support, above which it currently trades.

Should this level fail to hold, the token’s price will fall to $0.42. On the other hand, if buying activity resumes, XLM’s price will reclaim its three-year high of $0.63 and attempt to rally past it.
.aff-primary {
display: none;
}
.aff-secondary {
display: block;
}
.aff-ternary {
display: none;
}
Disclaimer
In line with the Trust Project guidelines, this price analysis article is for informational purposes only and should not be considered financial or investment advice. BeInCrypto is committed to accurate, unbiased reporting, but market conditions are subject to change without notice. Always conduct your own research and consult with a professional before making any financial decisions. Please note that our Terms and Conditions, Privacy Policy, and Disclaimers have been updated.
Sponsored

#placement_727536_0{ width: 100%;
height: 100%;}
#placement_727536_0_iframe{ width: 100%;
height: 100%;}
Sponsored
19 mins ago
55 mins ago
2 hours ago
3 hours ago
11 hours ago


