Shiba Inu (SHIB) coin holders, instrumental in the meme coin’s recent recovery, are driving the potential for another rally. Over the past three days, a significant number of SHIB tokens have been moved off exchanges, signaling strong activity.
With this in place, SHIB’s price might climb above $0.000025. But do other metrics align with the bias?
Shiba Inu Investors Continue to HODL
.divm, .divd {display: none;}
@media screen and (max-width: 768px) {.divm {display: block;}}@media screen and (min-width: 769px) {
.divd {display: block;}}
Sponsored
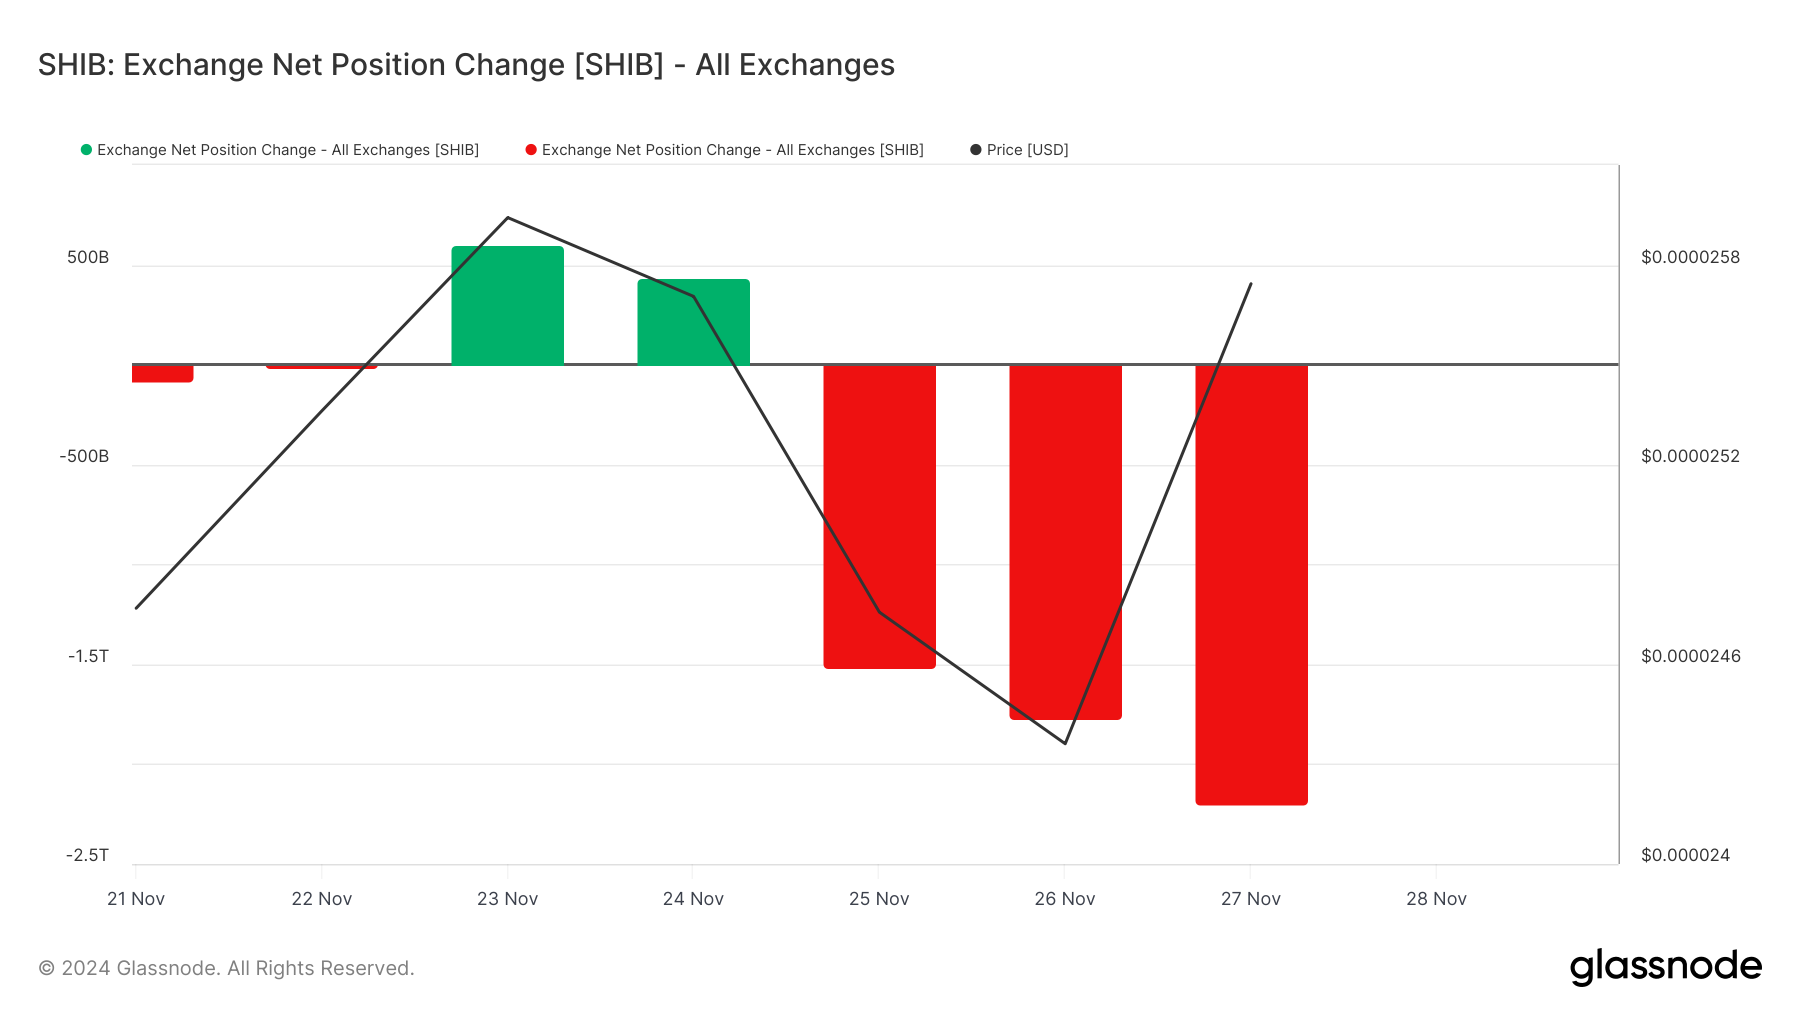
On November 23, Glassnode data showed an increase in the number of SHIB tokens on exchanges. Interestingly, this coincided with the token’s price drop to $0.000024. However, over the last three days, Shiba Inu coin holders have taken a cumulative 5.45 trillion tokens off exchanges.
At the cryptocurrency’s current price, this is worth about $162 million. Typically, when more tokens enter exchanges, it means that most holders are willing to sell, which could negatively affect the price.
Since most Shiba Inu coin holders move their assets off these platforms, they do not plan to let go in the short term. If sustained, then SHIB’s price could climb higher soon.
Sponsored

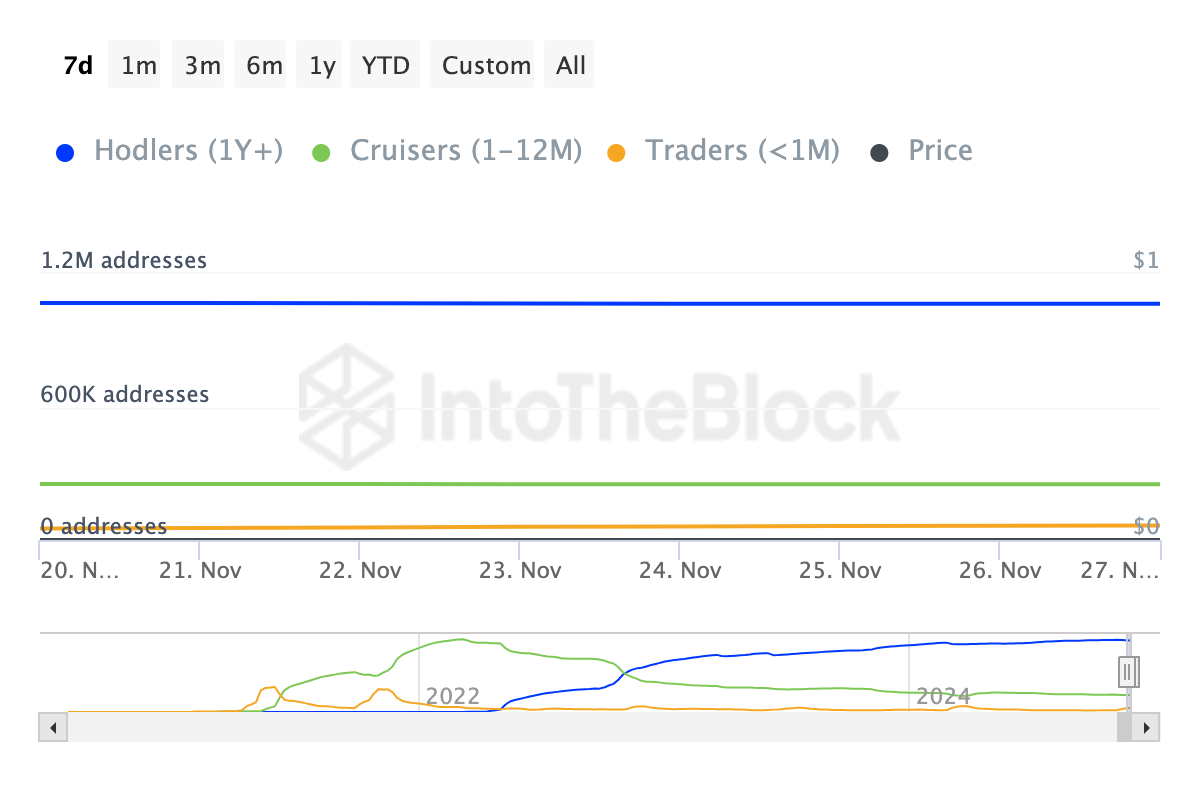
Besides that, data from IntoTheBlock shows that several short-term SHIB holders have refrained from selling the token within the last 30 days. This data is according to the Balance by Time Held.
When the metric increases, it implies that most holders still have a chunk of the asset in their possession. On the other hand, a decline implies that most are selling, which is bearish for the cryptocurrency.
Therefore, if these short-term Shiba Inu holders maintain their position, then the token’s value might not experience a significant drawdown.

SHIB Price Prediction: Token Forms Bull Flag
.divm, .divd {display: none;}
@media screen and (max-width: 768px) {.divm {display: block;}}@media screen and (min-width: 769px) {
.divd {display: block;}}
Sponsored
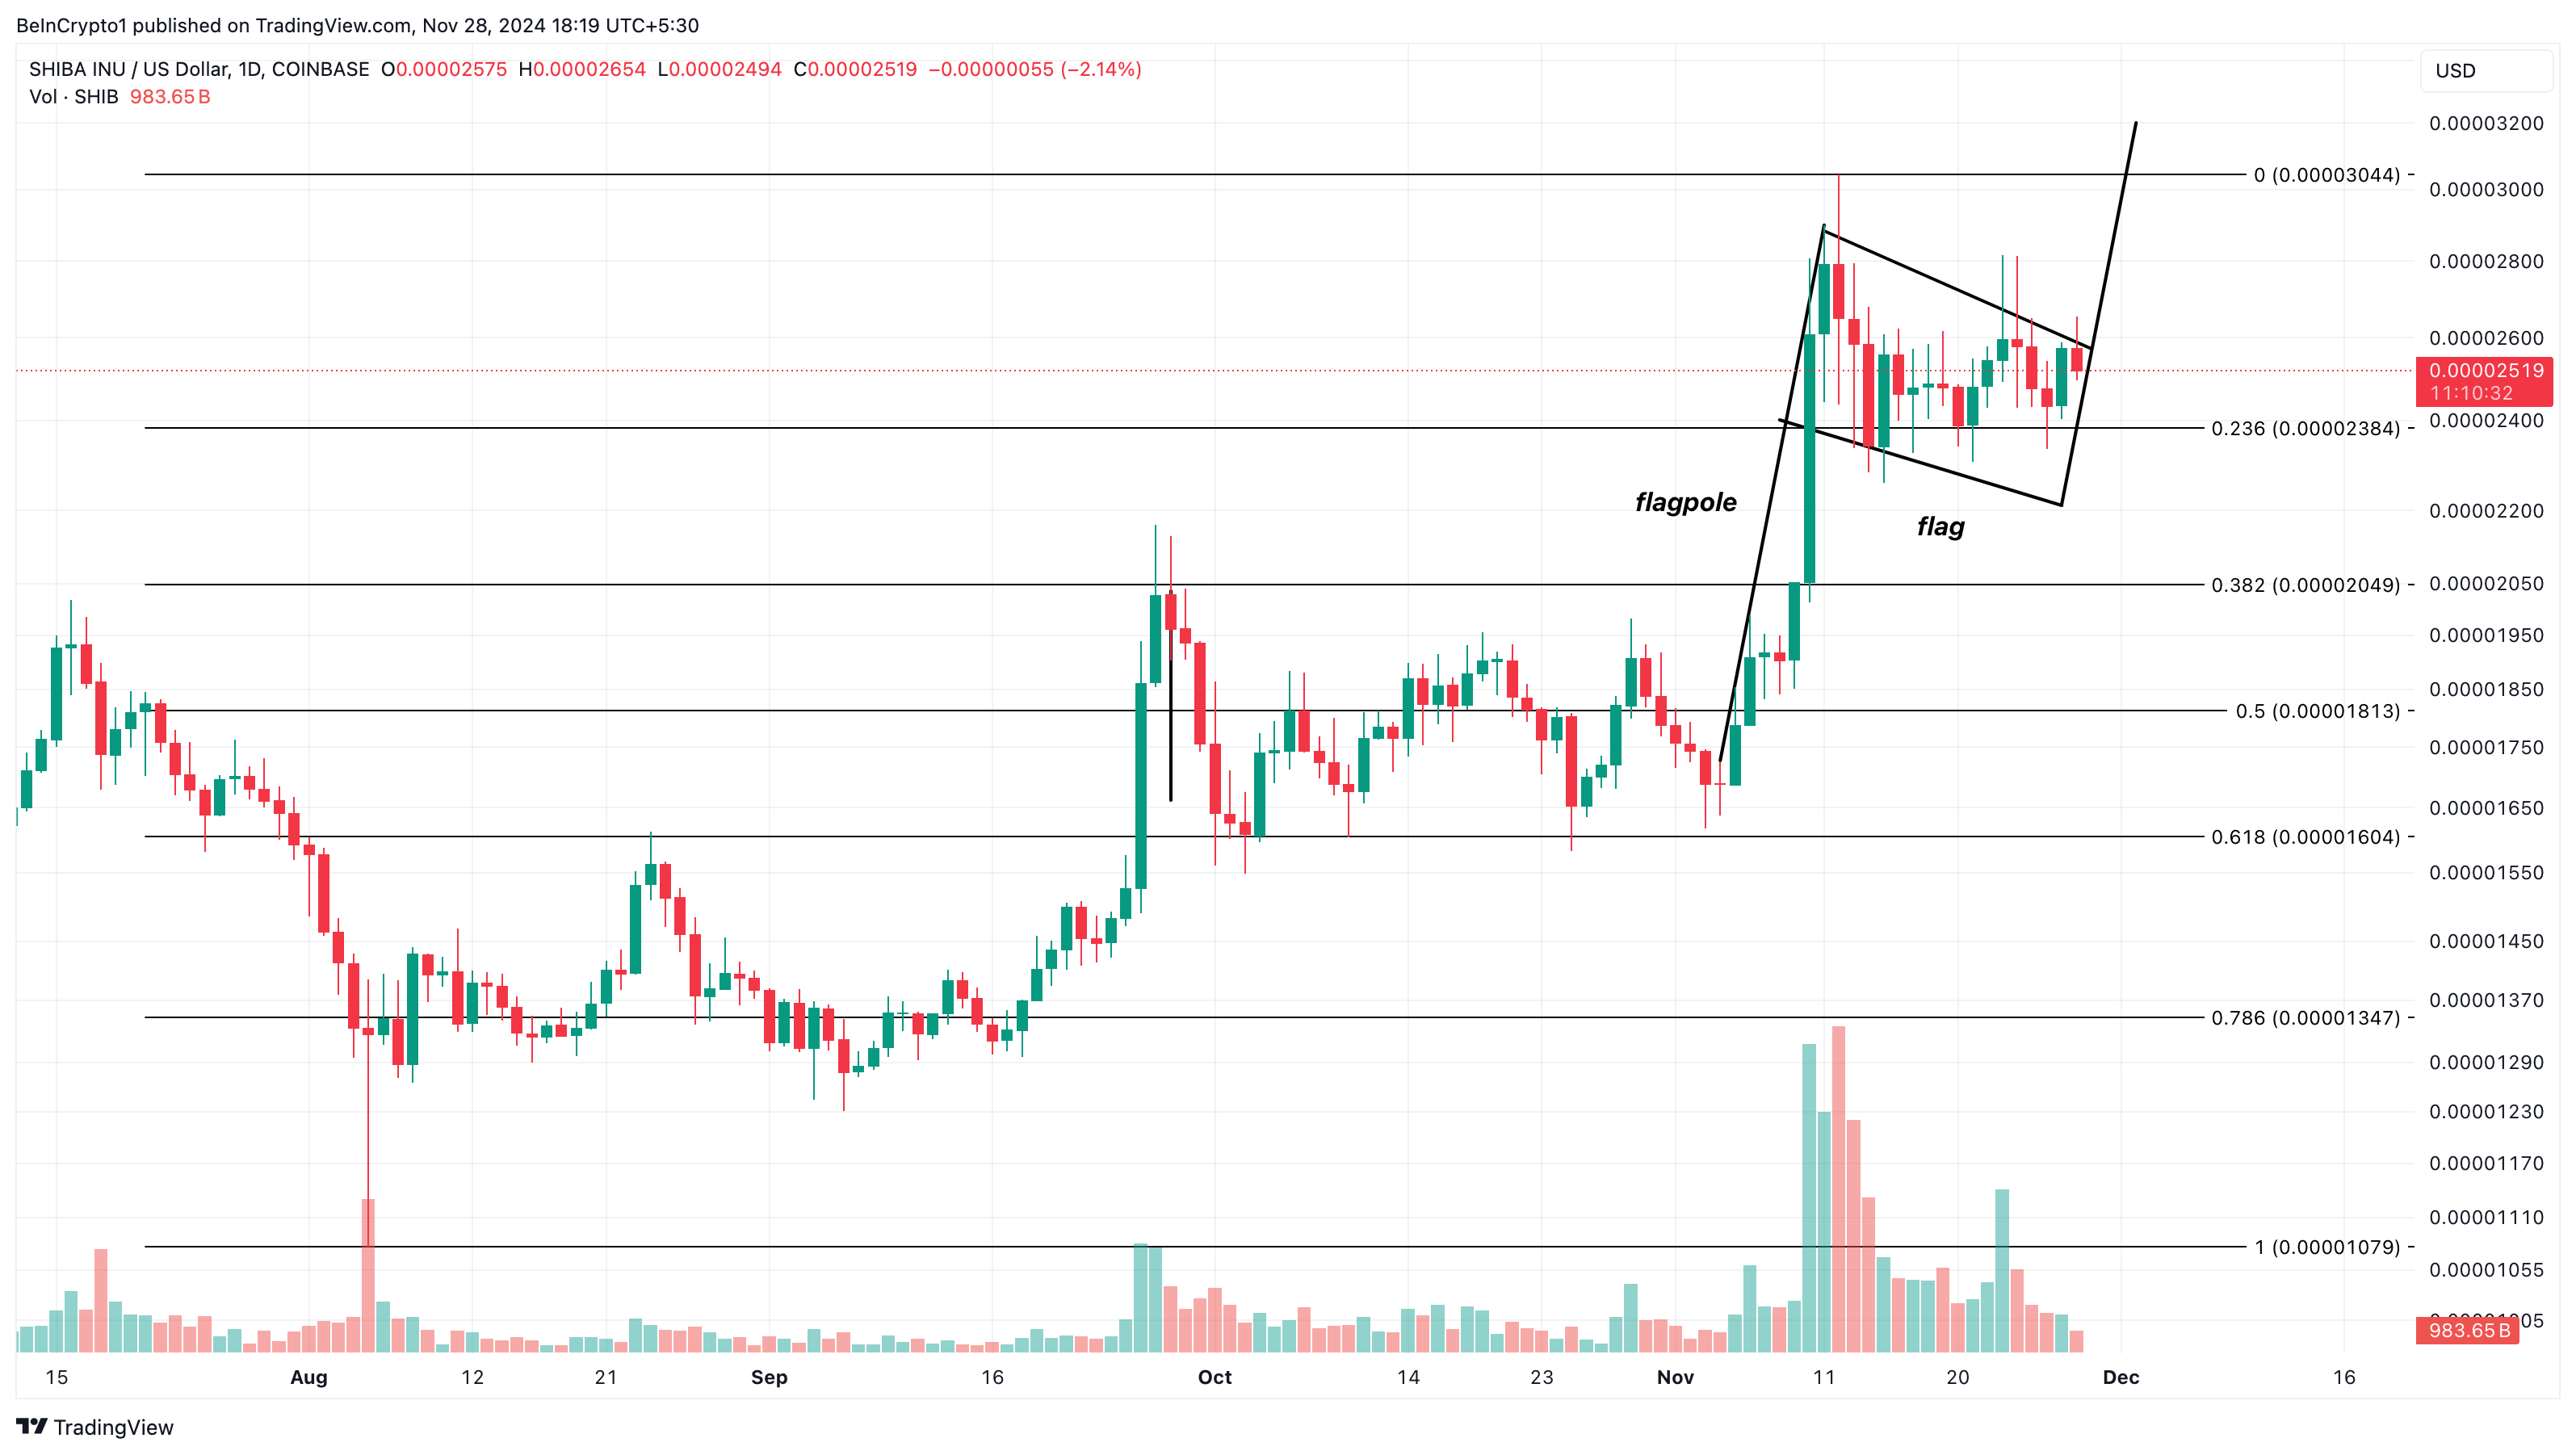
On the daily chart, SHIB’s price has formed a bull flag on the daily chart. A “bull flag” is a technical chart pattern that indicates a potential continuation of an uptrend. It begins with a sharp price surge (the “flagpole”) followed by a brief consolidation in a tight range (the “flag”).
This pattern resembles a flag on a pole and suggests that once the consolidation phase ends, the price is likely to break out. As seen below, SHIB’s price seems to be following this pattern. Thus, if buying pressure increases, the token’s value could surge to $0.000030.

In a highly bullish scenario, the crypto’s value could rise to $0.000032. On the flip side, if Shiba Inu coin holders decided to move more tokens into exchanges, this trend might change. Should that be the case, the meme coin could drop to $0.000020.
.aff-primary {
display: none;
}
.aff-secondary {
display: block;
}
.aff-ternary {
display: none;
}
Disclaimer
In line with the Trust Project guidelines, this price analysis article is for informational purposes only and should not be considered financial or investment advice. BeInCrypto is committed to accurate, unbiased reporting, but market conditions are subject to change without notice. Always conduct your own research and consult with a professional before making any financial decisions. Please note that our Terms and Conditions, Privacy Policy, and Disclaimers have been updated.
Sponsored

#placement_727536_0{ width: 100%;
height: 100%;}
#placement_727536_0_iframe{ width: 100%;
height: 100%;}
Sponsored
34 mins ago
1 hour ago
2 hours ago
3 hours ago
3 hours ago


